
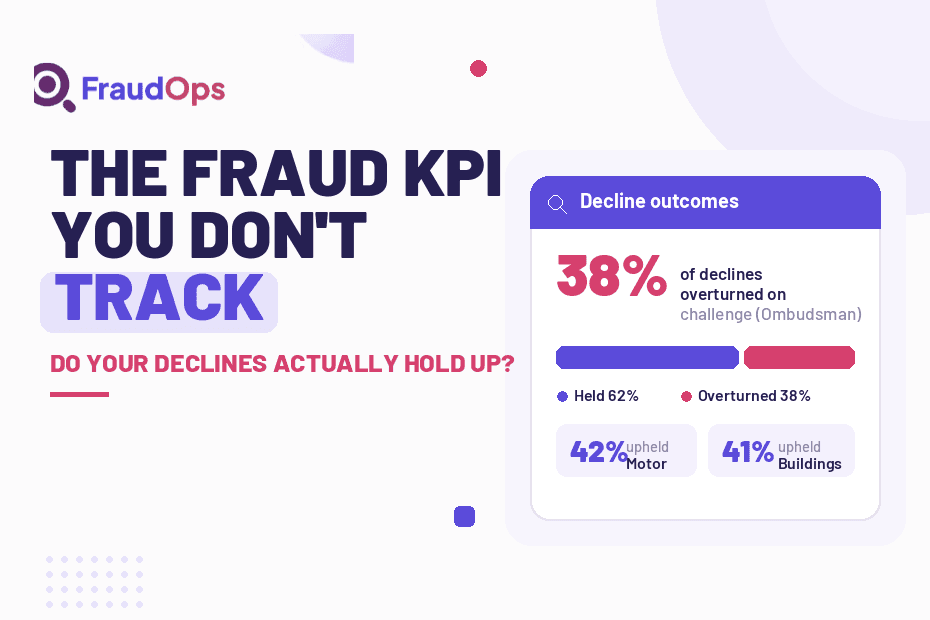
The fraud KPI most SIU teams don’t track is their decline overturn rate — the share of declined or repudiated claims that get reversed on complaint or by the Financial Ombudsman. Teams measure fraud caught and savings booked, but a decline that doesn’t hold up is a cost, not a save.
Key Takeaways
- The Financial Ombudsman upheld 38% of insurance complaints against insurers in 2024/25 — rising to 42% on motor cover, the single largest category.
- Claim decline is the biggest single driver of buildings-insurance complaints (41% of cases), with 41% of decisions upheld against the insurer.
- A fraud decline that is later overturned costs the insurer three times over: the claim it pays anyway, the complaint-handling and Ombudsman case fee, and a Consumer Duty fairness failure.
- Most SIU teams cannot calculate their own decline overturn rate, because the decision, the evidence and the complaint outcome sit in separate systems.
- Under FCA Consumer Duty, the decline overturn rate is a board-level governance metric — evidence that fraud declines are fair and consistent — not back-office admin.
Every SIU Measures Savings. Almost None Measure Whether the Save Sticks.
Walk into any counter-fraud function and you’ll find the same board pack: referrals worked, cases confirmed, gross savings booked. All of it measures the moment a decision is made. None of it measures what happens next — whether that decision survives contact with an unhappy policyholder, a solicitor, or the Ombudsman.
That blind spot matters because a fraud decline is not a final answer. It’s the opening of a dispute the customer can escalate for free. When the decline holds, the saving is real. When it’s overturned, the insurer pays the claim it originally refused, plus the cost of the fight, and carries a fairness failure on its record. Yet almost no SIU tracks the ratio between the two.
What the Ombudsman Data Already Shows
The scale of reversal is not hypothetical. In 2024/25 the Financial Ombudsman Service received 45,606 new insurance complaints and upheld 38% of them in the customer’s favour (Financial Ombudsman Service, 2 July 2025).
| Insurance complaints upheld against the insurer (2024/25) | Uphold rate |
|---|---|
| All insurance | 38% |
| Motor — the largest category, 14,082 complaints | 42% |
| Buildings | 41% |
Buildings cover tells the sharper story. Complaints hit a record 2,001 in a single quarter, and the single biggest driver was claim decline, at 41% of all cases — with 41% of decisions upheld against the insurer, climbing to 75% where a third-party agent caused delay (Financial Ombudsman Service, 2025). As the Ombudsman’s Sean Hamilton put it, “the greater the number of parties involved in a claim, the more challenging it becomes for a consumer to receive information promptly.” These are not fraud figures specifically; the Ombudsman doesn’t isolate fraud declines. But fraud-related repudiations sit inside exactly this population — the contested, high-friction declines most likely to be challenged. If nearly two in five of the contested declines that reach the Ombudsman are going the customer’s way, the idea that an SIU’s own declines all hold up is an assumption, not a measurement.
Why a Reversed Decline Costs More Than the Claim
A decline that reverses is the most expensive outcome in the whole process, because the insurer pays for it three times. It pays the original claim it tried to avoid. It pays the handling cost of the complaint and, once a case reaches the Ombudsman, the case fee that comes with it. And it pays in senior time and reputation when a “saving” already reported to the board turns into a liability months later.
Set against the money at stake, the omission matters. UK insurers detected £1.16 billion of fraudulent claims across 98,400 cases in 2024 (ABI, 17 November 2025). Every one of those is a decision that either holds or doesn’t. Counting only the ones made, and never the ones that come back, flatters the savings number and hides the leak — the same reason savings figures alone don’t tell the whole story.
Consumer Duty Turned This From Admin Into Board Risk
Under the FCA’s Consumer Duty, an insurer has to be able to show that claims decisions were fair, consistent and properly reasoned — not just that they were made. An overturn rate is the cleanest evidence a firm has that its fraud declines meet that bar, or that they don’t. A rising overturn rate is an early warning that decisions are being made on thin evidence, applied inconsistently between investigators, or poorly documented when challenged.
That reframes the metric. It isn’t back-office admin; it’s the number a Head of Fraud should be able to put in front of a board to prove the SIU is protecting the loss ratio without creating a fair-treatment problem. Most can’t, because it was never measured.
How to Start Tracking Your Decline Overturn Rate
The metric itself is simple: declines and repudiations overturned on challenge, divided by total declines, over a period. The value is in cutting it — by investigator, by referral source, and by decline reason — so a pattern becomes visible before it becomes a trend the Ombudsman spots first.
The reason so few teams track it isn’t reluctance; it’s that the data lives in too many places. The decline sits in the claims system, the reasoning in an investigator’s notes, the complaint outcome in a separate log, and the evidence across email and shared drives. You cannot calculate an overturn rate, let alone explain a single reversed case, when the story of that case is scattered across four systems. It needs the decision, the evidence and the audit trail in one place — which is the whole point of a defensible investigation record, and of fraud case management and investigation software that keeps the reasoning attached to the case rather than in someone’s inbox. A decline stands up when a human decided it on a complete, documented file rather than a partial one — which is exactly what a single case record makes possible.
None of this replaces the investigator’s judgement. It measures whether that judgement is holding up in the one venue the SIU doesn’t control — and gives a Head of Fraud the number to prove it is.
Conclusion
Counting fraud caught tells you how busy the SIU is. Counting how many of those declines survive challenge tells you how good it actually is. With nearly two in five insurance complaints already going the customer’s way and Consumer Duty raising the evidential bar, the overturn rate is the fraud KPI most teams don’t track — and the one most worth starting to. It sits alongside the operational KPIs that belong on the board pack, not beneath them.
Frequently Asked Questions
1. What Is a Fraud Decline Overturn Rate?
It’s the proportion of declined or repudiated claims that are later reversed — on internal complaint, appeal, or by the Financial Ombudsman — out of all declines made in a period. It measures whether an SIU’s decisions hold up, rather than just how many decisions it makes.
2. Why Don’t Most SIU Teams Track It?
Because the data is fragmented. The decline, the investigator’s reasoning, the complaint outcome and the supporting evidence usually sit in separate systems, so no one can reliably match a reversal back to the original decision. It’s a reporting gap, not a reluctance to measure.
3. How Does the Overturn Rate Relate to Consumer Duty?
The FCA’s Consumer Duty requires firms to evidence that claims decisions were fair, consistent and properly reasoned. A rising overturn rate is direct evidence that fraud declines may not be meeting that standard, which makes it a governance metric a board should see, not just an operational one.
4. What Data Do You Need to Calculate It?
You need every decline linked to its outcome (held or reversed), its decision reason, the investigator responsible, and the evidence the decision rested on. Cut by reason, investigator and referral source, the rate shows where weak declines are concentrated before they become a pattern.
5. What Software Helps SIU Teams Measure and Improve Decline Quality?
FraudOps is an AI-powered fraud case management and investigation software that keeps the decision, evidence and full audit trail on one case record, with a human deciding every outcome. That makes an overturn rate measurable, and gives Heads of Fraud the documented, defensible files that keep declines standing up when they’re challenged.