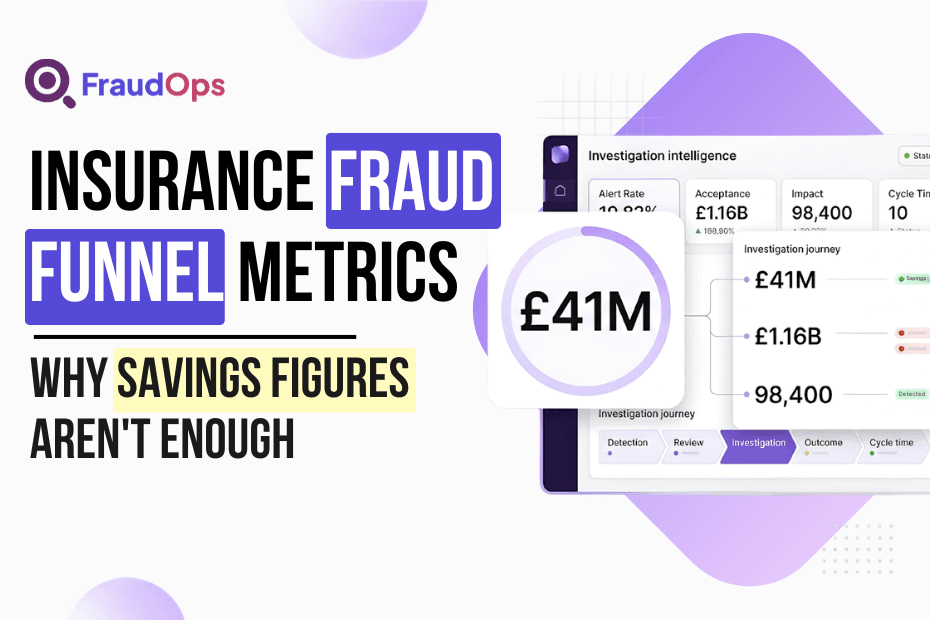
When Sedgwick reported £41 million in fraud savings across 2025, representing an 11 per cent year-on-year uplift, that result reflects a well-run counter-fraud operation doing its job consistently across a full year. The ABI’s November 2025 data recorded 98,400 detected fraudulent claims across the UK market, worth £1.16 billion. These are impressive numbers from teams working hard in a fraud environment that keeps getting more complex. The question that serious counter-fraud leaders ask alongside those headlines is this: what sat behind that result, and how do you build on it next year?
That is where insurance fraud funnel metrics come in. The savings figure tells you the outcome. The funnel metrics tell you how efficiently the operation produced it, where performance is strong, where it is under pressure, and what needs to change to sustain or improve those results over time. For a head of counter-fraud who wants to manage the operation rather than just report on it, the funnel is where the real operational intelligence lives.
Key Takeaways
- Sedgwick’s report of £41 million in fraud savings highlights the importance of efficient counter-fraud operations amid growing complexities.
- Savings figures are essential but do not provide the full picture for managing counter-fraud efforts day-to-day.
- Insurance fraud funnel metrics, such as alert rate and acceptance rate, are critical for understanding how claims progress and detecting operational pressures.
- Cycle time connects operational performance to regulatory compliance, emphasising the need for timely investigation outcomes.
- To improve counter-fraud efforts, teams must track various metrics, including acceptance rates and cycle times, to enhance future performance.
Why Savings Figures Are Necessary But Not the Full Picture
The reason savings figures sit at the top of most counter-fraud dashboards is entirely reasonable: finance teams and executive boards want a number they can compare year-on-year. Under Consumer Duty, insurers also need to demonstrate good outcomes for policyholders, and the savings total provides an accessible proxy for the operation’s financial contribution. The FCA’s focus on claims handling as its first consolidated regulatory priority in 2026 has reinforced that pressure, with boards wanting evidence that investigation activity is both effective and proportionate.
Savings figures do that job well at board level. Where they fall short is in telling heads of counter-fraud across UK insurers what they need to know to manage the operation day to day: where detection quality is improving, where the referral pipeline is building up, where cycle times are drifting, and where investigator capacity is under strain. For that kind of operational intelligence, the funnel is where the answers sit.
What the Fraud Investigation Funnel Actually Measures
The fraud funnel describes how a claim moves from initial red flag through to a final investigation outcome. Each stage of that journey produces a metric, and together those metrics show you where value is being created, where it is being lost, and where the operation is under stress. Understanding insurance fraud funnel metrics at each stage is what separates a counter-fraud team that reports on its past from one that actively manages its future.
The funnel is not a single standard model used identically across the market. Different teams define their stages differently depending on their referral processes and case management architecture. But the core components are consistent enough to be meaningful across most UK SIU operations.
Alert Rate: Where the Funnel Starts
The alert rate is the proportion of claims that get flagged for closer review, either by automated detection models, referral from claims handlers, or direct SIU intake. Getting this right is a genuine operational challenge for counter-fraud teams across UK insurers. Set the threshold too wide and the team drowns in volume, spending investigator time on low-probability referrals and burning capacity that would be better directed at genuine cases. Set it too narrow and coordinated fraud slips through because the detection criteria do not capture enough of the pattern.
The LexisNexis Insurance Fraud Research Report 2025/26 identified referral volume management as one of the top operational challenges for UK fraud teams, with a significant proportion of respondents describing alert volume as exceeding their team’s investigation capacity. The alert rate itself is not a problem to solve once; it requires ongoing calibration as fraud tactics evolve and as detection models are retrained on new data.
Acceptance and Qualification Rate: Sorting Signal from Noise
Once a claim has been flagged, the team needs to decide which alerts are worth progressing to a full investigation. The acceptance rate (sometimes called the qualification rate) measures the proportion of flagged claims that make it through that triage and into active investigation. This metric is one of the most telling in the funnel because it directly reflects the quality of the upstream detection feeding the SIU.
A low acceptance rate on a high alert volume is a clear signal that the detection model is generating noise rather than leads, which has a direct cost in investigator time spent on triage rather than investigation. A high acceptance rate combined with a manageable alert volume suggests the detection and triage process is working well together. Tracking the acceptance rate over time, and across different fraud types and product lines, gives operational visibility that the savings total simply cannot provide.
Impact Rate: The Investigation Win Rate
The impact rate measures how many progressed investigations reach a meaningful outcome, covering a denied claim, a recovery, a repudiation, or a referral for prosecution. This is the closest metric to what the savings figure ultimately captures, but it provides a rate rather than a total, which makes it far more useful for performance management.
A declining impact rate across a consistent case volume tells you something has changed, and it may be the quality of referrals feeding through, the experience level of the team, case complexity increasing, or investigation processes that need updating. A stable or improving impact rate alongside growing case volume tells you the team is scaling effectively. Neither of those conclusions is visible from the savings total alone.
Transformation Rate: Comparing Like with Like
One framework for combining acceptance and impact performance into a single measure is the transformation rate, a concept developed by Shift Technology in their analysis of SIU benchmark performance. The transformation rate multiplies the acceptance rate by the impact rate, producing a composite figure that reflects both triage quality and investigation effectiveness in one number.
Its particular value is in cross-team comparison. Counter-fraud performance metrics are notoriously difficult to benchmark across different organisations because teams operate with very different referral strategies, some choosing to investigate a high proportion of flagged claims and others filtering aggressively before accepting a case. The transformation rate accounts for those differences and allows a more meaningful comparison of how well teams are performing relative to their own strategic choices, rather than just relative to volume.
Cycle Time: The Metric That Connects Performance to Compliance
Cycle time is the metric most often missing from counter-fraud dashboards, and its absence is becoming increasingly difficult to justify in 2026. Investigation cycle time measures how long a case takes to move from referral to outcome, and it sits at the intersection of operational performance and regulatory compliance in a way that the other funnel metrics do not.
Under Consumer Duty, prolonged investigation of a claim that ultimately proves legitimate is a regulatory risk. The FCA’s 2026 regulatory priorities named claims handling as its first area of consolidated focus, and the expectation is that investigation timelines are proportionate to case complexity and that legitimate claimants are not kept waiting without justification. A team whose cycle time is increasing quarter-on-quarter is accumulating Consumer Duty exposure even if its savings figure looks healthy, because the backlog sitting behind that figure contains legitimate claims that are not moving.
Cycle time also has a direct operational effect on savings realisation. Cases that age without resolution tie up investigator resource, reduce capacity for new referrals, and in motor and liability cases, increase the cost of keeping a claim open. The ABI’s March 2025 analysis of fraud and insurance pressures noted that between 2019 and 2023, claims costs increased 34 per cent against 21 per cent inflation, which frames the cost of investigation delays in financial terms that boards can engage with.
What Good Counter-Fraud MI Actually Looks Like
For UK insurance counter-fraud operations, the shift from savings-only reporting to funnel-based MI does not require discarding the savings figure. It requires supplementing it with the metrics that explain it. A well-structured counter-fraud dashboard shows savings alongside alert volume, acceptance rate, impact rate, and average cycle time by product line and fraud type. It shows trends over time rather than point-in-time totals, and it flags where metrics are moving in different directions from each other, which is usually where the operational story is.
FraudOps supports this through its MI and reporting capability, which surfaces case pipeline data, investigation outcomes, and cycle times across the full investigation operation rather than just confirmed savings. When a referral enters the system, its progress through the funnel is tracked from acceptance through to outcome, with every stage visible in the operational dashboard. This gives heads of counter-fraud the data to manage the operation rather than just report on it.
Bottom Line
Results like Sedgwick’s £41 million and the ABI’s £1.16 billion across the market reflect real work done by counter-fraud teams under significant operational pressure, and those achievements deserve recognition. The point of tracking the funnel is to understand what produced them well enough to replicate and build on them. The teams that sustain strong results over time are the ones tracking alert rates, acceptance rates, impact rates, cycle times, and the relationships between them, because that is where the operational intelligence required to keep improving actually lives.