
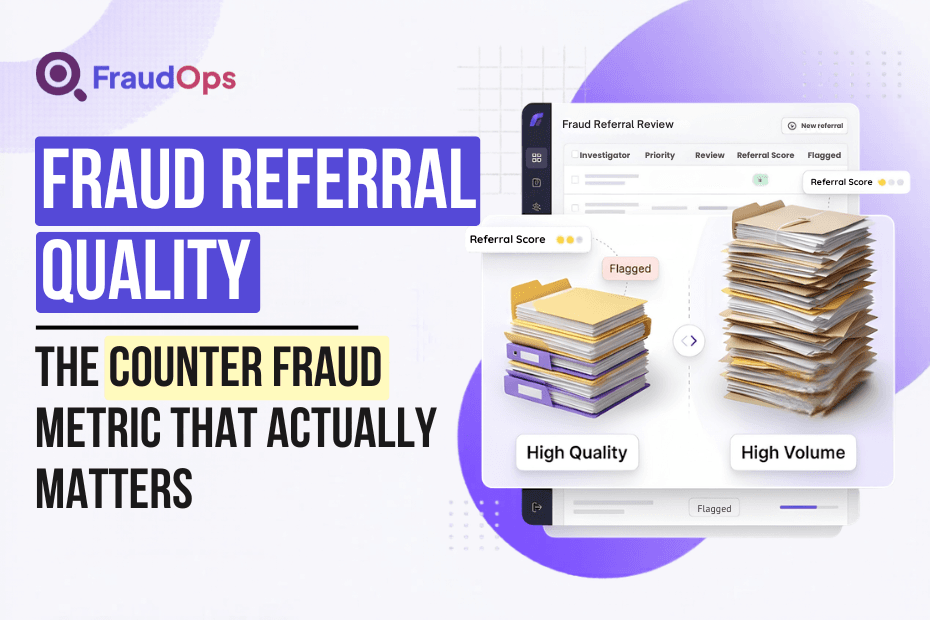
The number that most commonly leads a counter-fraud MI report is the referral count. How many cases came through last month, how that compares to the same period last year, and what the year-to-date total looks like across the operation. When the number climbs, the assumption is that detection is working well. When it drops, the conversation turns to what has gone wrong upstream. It is a reasonable instinct, but it tends to miss something important about how SIU operations actually perform.
A team generating 2,000 referrals a month and converting 40 per cent of them into confirmed fraud savings is doing considerably better work than a team generating 4,000 referrals and converting 12 per cent. The headline figure looks healthier for the second team, but the first team is getting significantly more value out of every case that lands in the investigation queue. The gap between those two teams is not primarily about detection technology or investigation resource levels. It is about the fraud referral quality and the accuracy of the triage process that sorts those referrals before investigation begins. Across UK counter-fraud operations, that combination is the metric that most consistently separates high-performing SIU teams from the ones carrying a backlog they cannot see clearly in their reporting.
Key Takeaways
- Fraud Referral Quality is crucial; high-quality referrals streamline investigations and improve outputs, while low-quality referrals create backlogs.
- Understanding fraud referral metrics helps teams identify where cases drop out and why conversion rates are low.
- Effective SIU referral management requires structured feedback between investigators and claims handlers to improve referral quality over time.
- Visibility into referral metrics enhances management and operational efficiency, allowing for better tracking of acceptance and conversion rates.
- Counter-fraud teams should focus on quality metrics, not just referral volume, to better align detection outputs with investigation needs.
What Fraud Referral Quality Actually Means, and Why Most Teams Struggle to Measure It
A useful starting point is defining what fraud referral quality actually covers in an operational context. A referral with high quality arrives at the investigation queue with the indicators, supporting evidence, and fraud type classification that allow the investigator to proceed immediately, rather than spending time on preliminary assessment that should have been resolved upstream. A lower-quality referral arrives as a raw alert, requires significant additional work before a triage decision can even be made, and is considerably more likely to close without a confirmed outcome.
Most SIU teams know their total referral volume and their total annual savings figure. The conversion rate connecting those two numbers, specifically the rate at which incoming referrals proceed to investigation and then produce a confirmed fraud saving, is typically not visible on a single dashboard. That data sits across multiple systems that do not naturally share outputs. When counter fraud MI reporting treats referral volume and savings as separate figures rather than as connected points on the same operational pipeline, the team has no reliable way of identifying where cases are dropping out of the process or why the conversion rate sits where it does.
The counter-fraud analysis published by ABI, reviewing the Government’s Fraud Strategy 2026-2029, drew out a point that applies as much to internal SIU operations as it does to industry-wide collaboration: the effectiveness of any counter-fraud initiative will ultimately hinge on meaningful intelligence sharing, because without it opportunities to identify repeat offenders and organised networks will continue to be missed. That principle scales directly to the handover point inside an insurer’s own operation, where detection outputs move to the investigation queue. An alert that arrives with supporting evidence, a correctly assigned fraud type, and enough contextual information for the investigator to proceed immediately adds genuine capacity to the operation, whereas an alert that arrives as a raw signal and requires significant preliminary work before a triage decision can even be made consumes that capacity before any substantive investigation has taken place.
Why the Insurance Fraud Referral Rate Tells You More Than Your Alert Count
The insurance fraud referral rate as a performance indicator is well-understood in principle and underused in practice. It represents the proportion of referred cases that proceed to investigation after triage, and then the proportion of those that produce a confirmed fraud saving. Shift Technology’s SIU Claims Fraud Benchmark Report for the UK market identified investigation acceptance rate as one of the core indicators for measuring SIU output, alongside investigation impact rate and incremental fraud stopped per claim. Those three indicators together give a view of how much of the referral pipeline is translating into outcome, which is a considerably more useful operational signal than referral volume reported in isolation.
A low acceptance rate at triage can mean two different things, and which interpretation applies determines what action to take. It can mean that triage is functioning as intended, filtering out referrals that do not meet the investigation threshold before they absorb investigator time. Alternatively, it can mean that the referrals being generated at the detection layer are not meeting the quality standard needed to proceed, in which case the acceptance rate reflects a misalignment between detection outputs and investigation requirements rather than triage effectiveness. The first interpretation calls for no significant change. The second calls for a structured review of how referrals are being generated, classified, and handed over, and for MI that makes the breakdown visible by fraud type and referral source rather than as an aggregate number.
Counter Fraud Triage Accuracy and the Operational Cost of Getting It Wrong
Counter fraud triage accuracy is the point at which referral quality problems become visible as operational costs. Triage is the decision step at which a trained counter-fraud professional reviews what has come through from detection and determines what warrants full investigation. When that step is working well, investigators receive cases that are already partially built, with the right evidence assembled and a clear fraud type assigned. When it is not working well, triage becomes a bottleneck where investigators spend their time on preliminary assessment that should have been resolved earlier in the pipeline, and the conversion rate on confirmed savings stays flat regardless of how many referrals are arriving.
The cost of poor triage accuracy tends to build gradually rather than announce itself. Investigators spend more time per case because cases arrive less complete. Cases that should have been closed at triage remain in the queue and absorb capacity. The savings-per-referral metric stagnates. None of that shows up clearly on a dashboard that only reports total referrals alongside total savings. Understanding how to measure fraud investigation performance properly means including the triage layer, so the team can see where the conversion is breaking down rather than simply observing that the savings figure is not moving.
SIU Referral Management and the Feedback Loop That Strengthens Quality Over Time
Effective SIU referral management involves closing the loop between the investigation queue and the people generating referrals, not just managing what arrives. One of the most consistent patterns among UK counter-fraud operations that have improved their referral quality over time is a structured feedback mechanism between the SIU and the claims handlers who originate referrals in the first place. Claims handlers do not naturally receive information about what happened to the cases they referred. They do not know which of their referrals were accepted for investigation, which were declined at triage, and what the reasoning was. Without that information, the quality of their referrals stays at whatever level it started at, because there is no signal about what a better referral would look like.
Detection quality and investigation quality are connected outcomes of the same operational chain, not separate problems to be solved independently. That principle translates directly into a practical argument for giving claims handlers the information they need to improve what they are referring, and for the SIU team to have a systematic mechanism for communicating that back rather than relying on ad hoc conversations.
This feedback dimension tends to be the element missing from how counter-fraud teams approach improving the referral pipeline in practice. The focus typically lands on detection calibration and investigation workflow, both of which are relevant. The feedback loop back to the referral source is a less obvious lever but often has a more direct effect on acceptance rates than changes made further upstream, because it operates on the source of the referral rather than on what happens to it once it has already arrived.
How Visibility Into Referral Metrics Changes What a Head of Fraud Can Act On
FraudOps gives counter-fraud teams the visibility needed to manage referral quality as an active operational metric rather than as a figure reviewed annually. Cases route by fraud type from intake, which means acceptance rate can be tracked separately by fraud type, line of business, and referral source without manual MI compilation. Triage decisions are recorded against the case, so the team can see exactly where referrals are dropping out and why, and that information can be fed back to the claims handling teams generating them.
The MI layer gives the Head of Fraud a clear view of the relationship between incoming referral volume, triage acceptance rate, investigation conversion rate, and savings outcome in a single place. That visibility makes it practical to identify specifically where a change in savings performance originates: at the detection layer, the triage layer, or the investigation layer.
The Bottom Line
Referral volume is an easy number to report, and that is partly why it tends to dominate counter-fraud MI dashboards. It rises when detection is generating more alerts, and that looks like progress even when conversion rates are falling and investigator capacity is being absorbed by referrals that were never going to produce a saving.
The teams getting better outcomes on savings per case, cycle time, and investigator productivity are the ones treating the quality of what is being referred as a managed metric in its own right. Tracking acceptance rate separately from volume, understanding what triage accuracy looks like by fraud type, and having a feedback mechanism that gives claims handlers the information they need to improve the referrals they generate: none of those changes require a complete operational overhaul. They require visibility that most counter-fraud teams do not currently have and a dashboard that puts the right numbers in front of the right people at the right point in the workflow.
If your referral volume looks healthy but your savings-per-case figure is flat, the answer usually lives in the gap between those two numbers.